On this page
Billing Reports
These 2 reports display billing information in dynamic graphs, with up to 1 year of history
They can be accessed in the BI Reports menu, in a separate “Billing” category and are linked to a specific user right.
For each report, multiple filters are at your disposal:
– Group
– Rate Plan
– Service Park (offer)
– charge category
– MSISDN
You can therefore analyze the charges on a group of SIMs, or even a single SIM.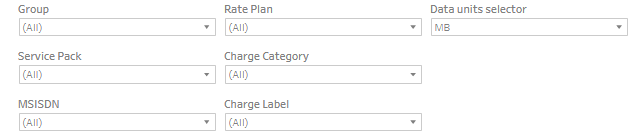
And as with all reports, you can download data for perform further analysis in Excel or just to export data.
To do so, click on the download button on top right corner![]()
and then select the type of file you wish to export your data in: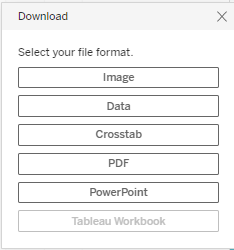
The first graph is an histogram view of the last year of invoices, split by type of charge:
– airtime
– account management fees
– fees bundles & options (fees at SIM/subscriber level)
– discount & credit notes
You can hover your cursor to display the values charged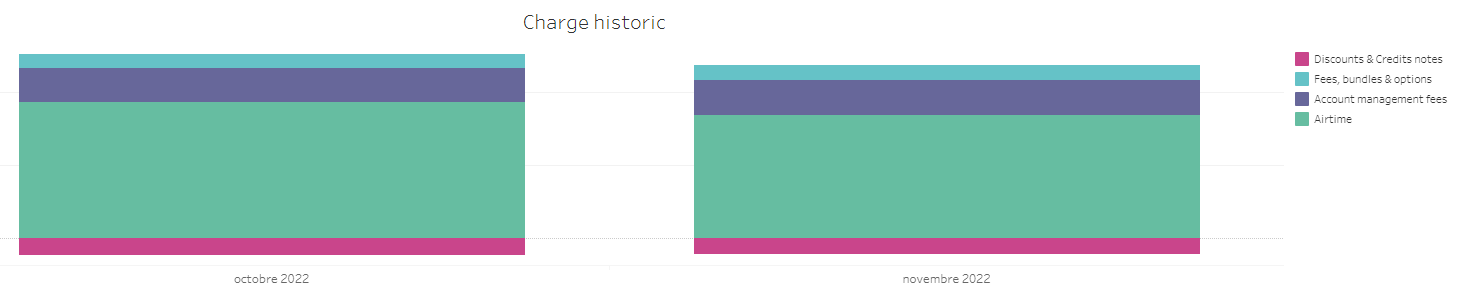
The bottom graph shows airtime usage for the same months, giving you a clear view of how much airtime volume was charged.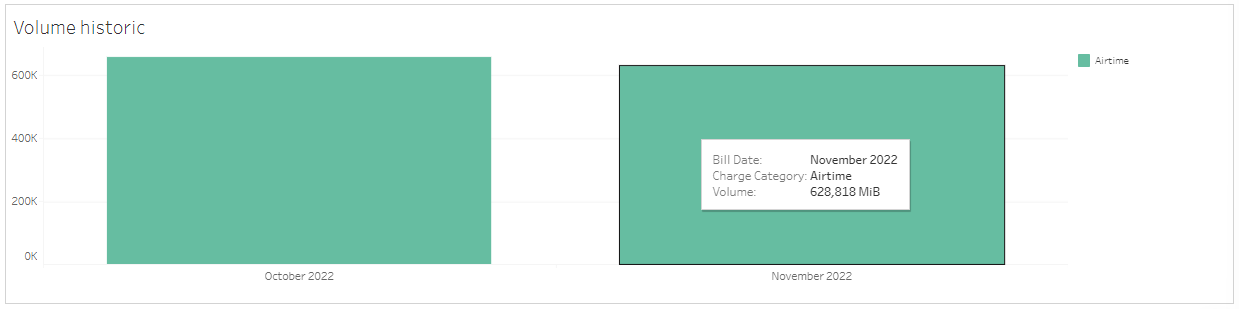
This graph shows :
– on the left, the SIMs with the highest charge for airtime
– on the right, the SIMs with the highest charge for Fees, bundles and options
You can change the invoice month in the filter, and you can also search for a specific SIM by MSISDN