On this page
Using the Usage Overview report
The usage overview includes 3 graphs to better understand your fleet’s usage trends.
You can select:
– the type of usage: data, SMS, voice
– the period: select days, weeks, months – we keep 1 year of history
– the unit: GB, MB or KB for data
Usage Graph
This first graph displays your fleet’s total daily usage over a period of time.
By hovering your cursor, usage on that day is displayed.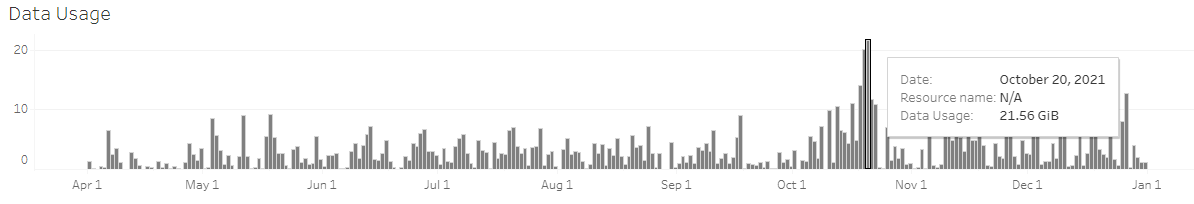
Active Lines
This second graph show the number of SIMs that generated at least one CDR (Call Detail Record) on each day.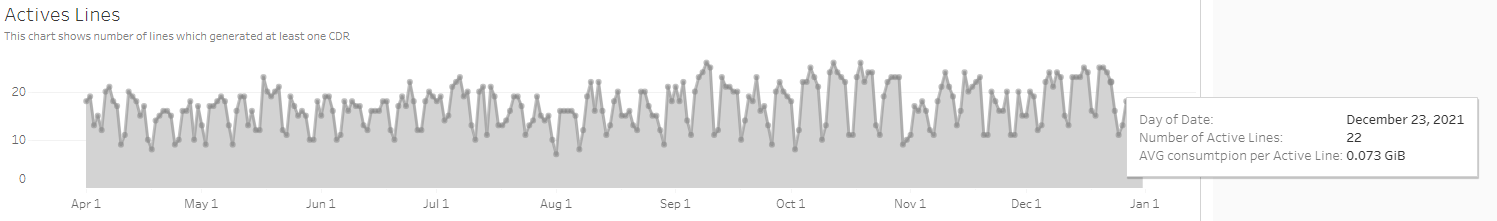
By hovering your cursor, you can display the number of active SIMs, as well as the average usage made by active lines that same day.
Monthly Average Usage Per Unit
This last graph shows the monthly average usage per SIM 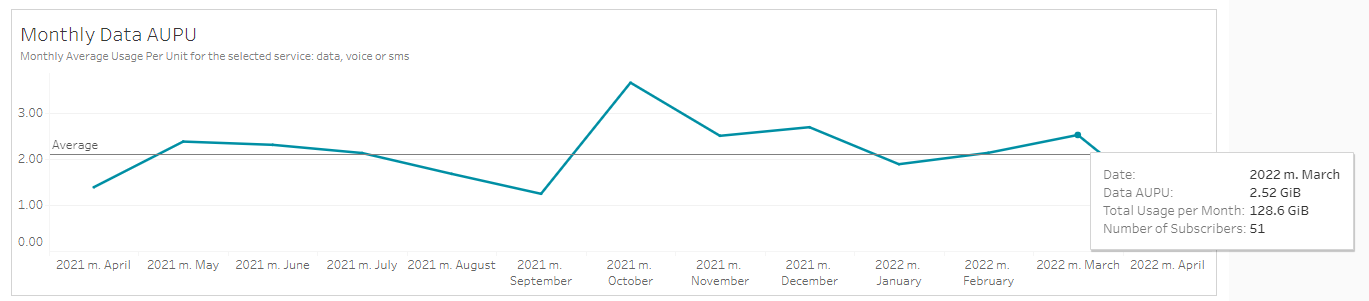
Downloading data
You can retrieve the data used to generate each graph in CSV format.
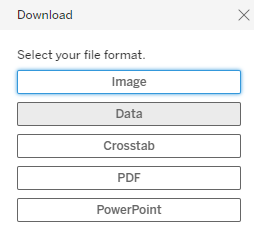
To do so, click on the relevant graph to select it, then click on the download button at the top right of the report. ![]()
If you have correctly selected a graph, you’ll see the the following choices to export data. Select “Data” to get a CSV file, and “Crosstab” to get a pivot table version in Excel format.