Analytics & Reports
This report gives you an overview of your fleet’s as a daily snapshot.
The snapshot is as of midnight UTC, and are refreshed around 3am UTC in the interface
/!\Changes made this very day will not be counted, and therefore may differ from real time numbers in the platform
You can filter data by using the filters on the left, or directly by selecting a value to keep in one of the graphs.
The selection will apply to all the values graphs in the report.
Fleet Statuses
The top of the report contains blocks highlighting how many SIMs are in each status, and the variation since the last week.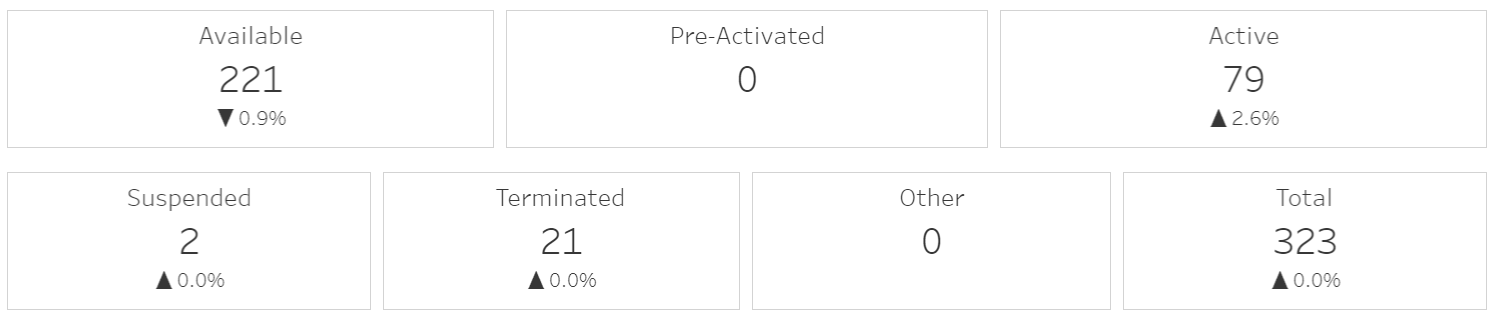
Historic Provisioning Status
Below is a histogram of the evolution of your fleet, split by status, over the past 3 months.
You can filter data by using the filter panel on the left, or directly by clicking on the value you want in the graphs.
Distribution graphs
At the bottom of the report, you have 3 fleet distribution graphs by Group, Rate Plan and Service Profile
You can then download the data in PDF or image format.![]()