
On this page
Using the Pooled bundle management report
The Pooled bundle report is currently in beta phase and slowly being deployed to our customers.
This article will explain how to make the most out of the report’s capabilities
The report has 4 main features:
– it shows you the consumption made part of the pool’s volume, out of bundle, and out of the pool’s geographic area all along the month (updated every hour)
– it displays the allowance remaining in the pool
– it highlights SIMs with the highest usage in the pool
– it calculates average usage, letting you know if the pool is the good fit
How does it work?
To access the report, go to Tracking & Reports > BI Reports, and in the drop-down list, select pooled bundles management
The report will open empty. To display data, select a pooled bundle and a month in the filter panel on the left side: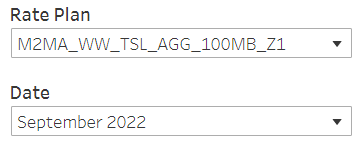
The report will then load data according to your selection.
The 3 squares at the top middle show usage for the month:
– made as part of the pool’s volume
– made out-of-bundle (if the pool’s volume was exhausted)
– made out-of-area (in a geographic location not included in the pool)
Usage is displayed in MB by default, but you can switch to KB or GB by using the filter on the right
Usage in green is in-bundle, and usage in pink is out-of-bundle (that is charged in addition of the pool’s monthly fee).
If your fleet is only consuming as part of the pooled bundle, it will look like this: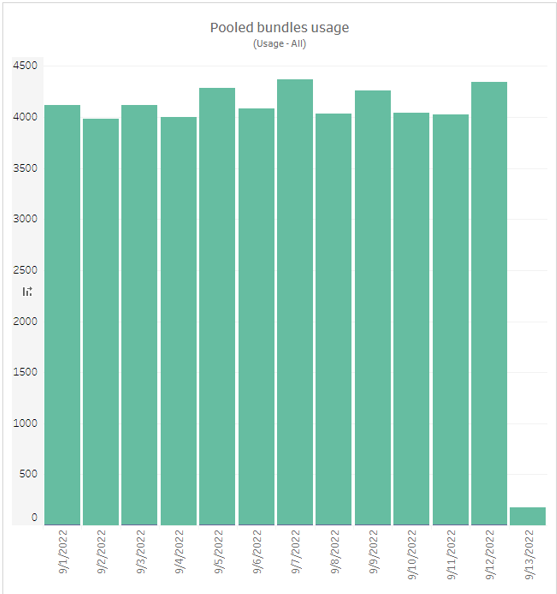
However, if some SIMs are making usage out-of-area or if the pool’s volume is exhausted, you’ll start to see out-of-bundle usage displayed in pink.
In the example below, we clearly see that the pool was exhausted on July 27th, and that the fleet started making out-of-bundle usage:
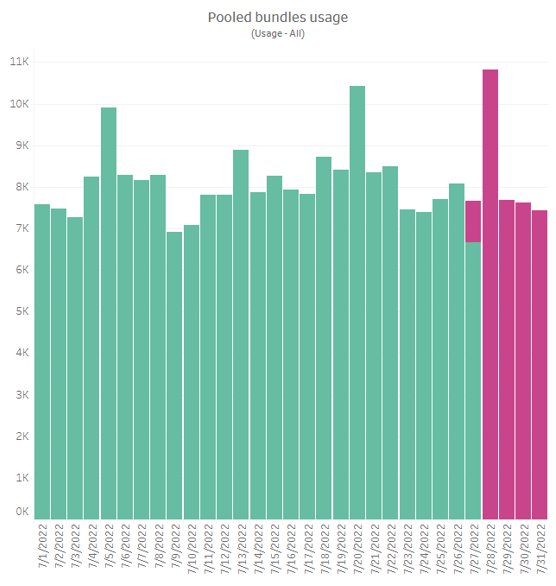
You can hover your cursor over each day to get the total usage in and out of bundle:
At the bottom, a second graph displays the pool’s remaining allowance:
Once the pool’s global allowance is depleted, it will reach 0.
If you have activated SIMs during the month, you’ll see that the pool increases with the newly active SIM’s allowance added to the total:
On the right side, you can show the 200 SIMs with the highest usage.
You have the possibility to filter on out-of-bundle usage or in-bundle usage only.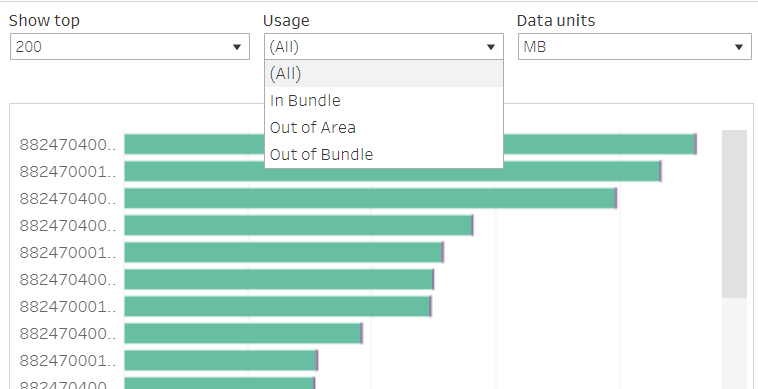
Click on a SIM, and the detailed view page will open in a new tab, enabling you to check if the usage is normal for this particular card.
Finally, the last item of the report shows:
– how many SIMs were in the pool at the beginning of the month – this gives a general idea of the total size of the pool (but additional SIMs activated since can have increased the total amount)
– how much data has been consumed in average by the SIM cards in use (SIMs with no data consumption during the month are not included in this average) – this lets you know if the pool’s volume is the right fit for your SIM’s average usage.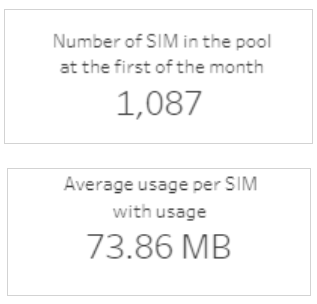
For example, if your SIMs with usage have consumed 73MB in average on a complete month, a 100MB pool is a good fit.