On this page
Checking a SIM’s data usage
Checking a SIM’s usage
To see a SIM’s usage, you have 2 possibilities:
- in the inventory pages, the usage made by the SIM since beginnign of the month will be displayed in the usage column
- and to go further, you can go to the SIM’s detailed page
SIM monthly usage
in the SIM list (in All Assets, or in any inventory view, you can see the data usage made since the beginning of the month by the SIMs of your fleet.
This is available for data (in GB), voice and SMS.
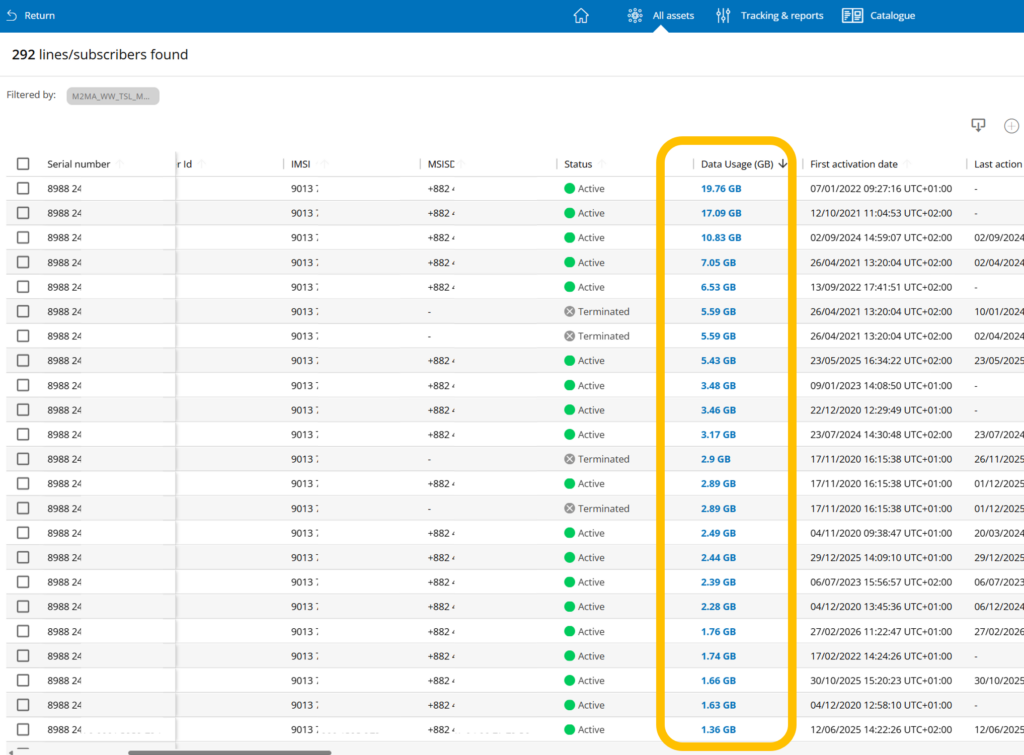
The field might be hidden to the right – use the “manage columns” button to drag it where you need

You can then sort by SIMs which made the most – or least usage
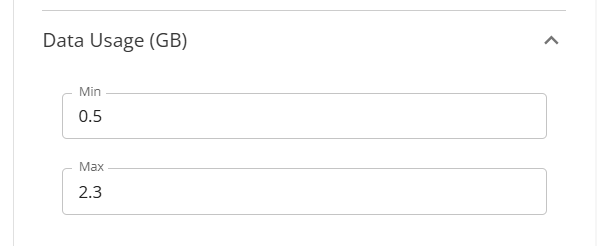
Additionally, you can use the filter panel to search for SIMs that made a specific volume in GB
for example…between 0.5 and 2.3GB
In the SIM’s detailed view
Usage can be displayed in table or in graph view:
The Graph view
You can now select to display data usage by:
- data session – in line with the device behaviour’s
- Call detail records – for a finer analysis with short intervals of a few minutes

The graph view is the most user-friendly way to display and understand usage.
Here’s a little use case. Here is the data usage of my SIM over the past months:
By hovering my cursor over the bars, the cumulated usage is displayed. I notice that this SIM has had an increased usage in December: 10GB
By toggling to daily view, I notice a high peak of usage happened on December 18th:
To go further, I’ll filter down on that very day, and toggle the view to hourly:
I can now see that out of the 10GB usage made on that day, 9.26GB were used just in a one-hour period! That’s good intel to start an investigation!
So let’s review the commands used:
The table view
The new table view is a much-enhanced version of old display.
First, you’ll notice that we now get an aggregated total of the usage
Please note that the total may not match 100% the usage amount you’ll find on your invoice. This is raw data, not the final version processed by our billing engine, therefore there can be discrepancies due to rounding, or to end of months CDRs counted in another month’s invoice.
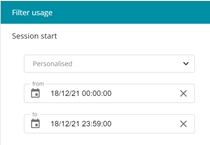
By default we display usage from the start of the current month, you can easily change the dates in the filter panel.
You can filter down to one specific month, day or even hour.
About time zones: please note that while our interface is matching your computer’s time and displays usage in local time, the timestamps present in the CSV export are in UTC format.
The table has been enriched with additional fields, and its design has been improved.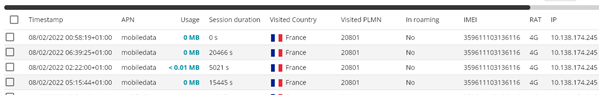
There are plenty of fields and ways to toggle the view to display exactly what you want to see.
Here are the commands available to you with the control buttons: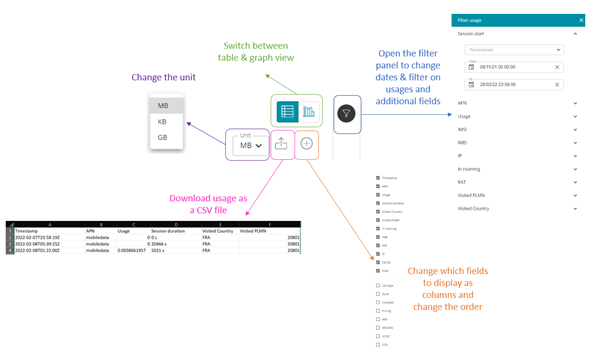
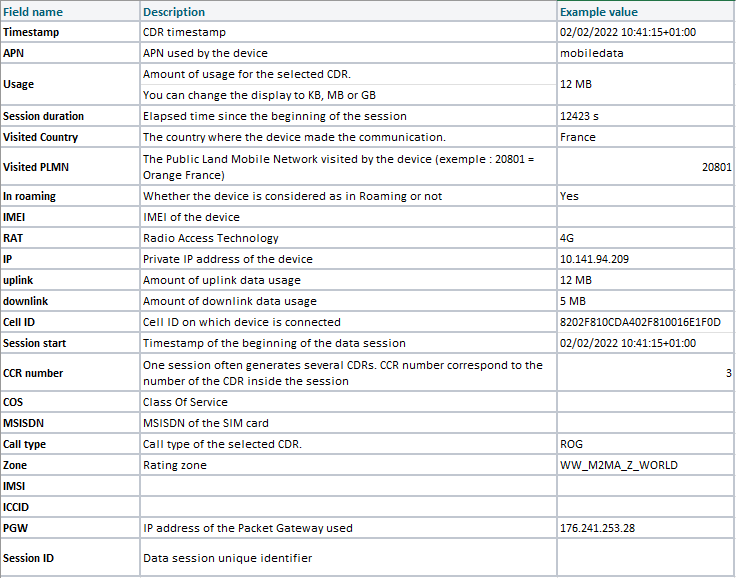
Fields available to filter usage
The Call Detail Records used to display aggregated usage contain many fields with advanced information.
In addition to being used as filter, all the fields will be displayed in the table view, and will be in the csv export as well.
About time zones: please note that while our interface is matching your computer’s time and displays usage in local time, the timestamps present in the CSV export are in UTC format.
Here is the full detailed list of the fields: